I Heart Data
Research
Data Visualization
Graphic Systems
Research
Data Visualization
Graphic Systems
Concept:
I Heart Data is a data visualization project that explores my own biometric data and portrays it graphically in order to help draw conculsions about daily factors throughout my life and how they affect the thing that keeps me going- my heart.
Execution:
After collecting both qualitative and quantitative data about my life over the course of a 24 hour period, I Heart Data connects these pieces of information to their correlation with my heartrate taken at 30 minute intervals. The data is then organized into numerical systems with explorations into various ways of visual communication.
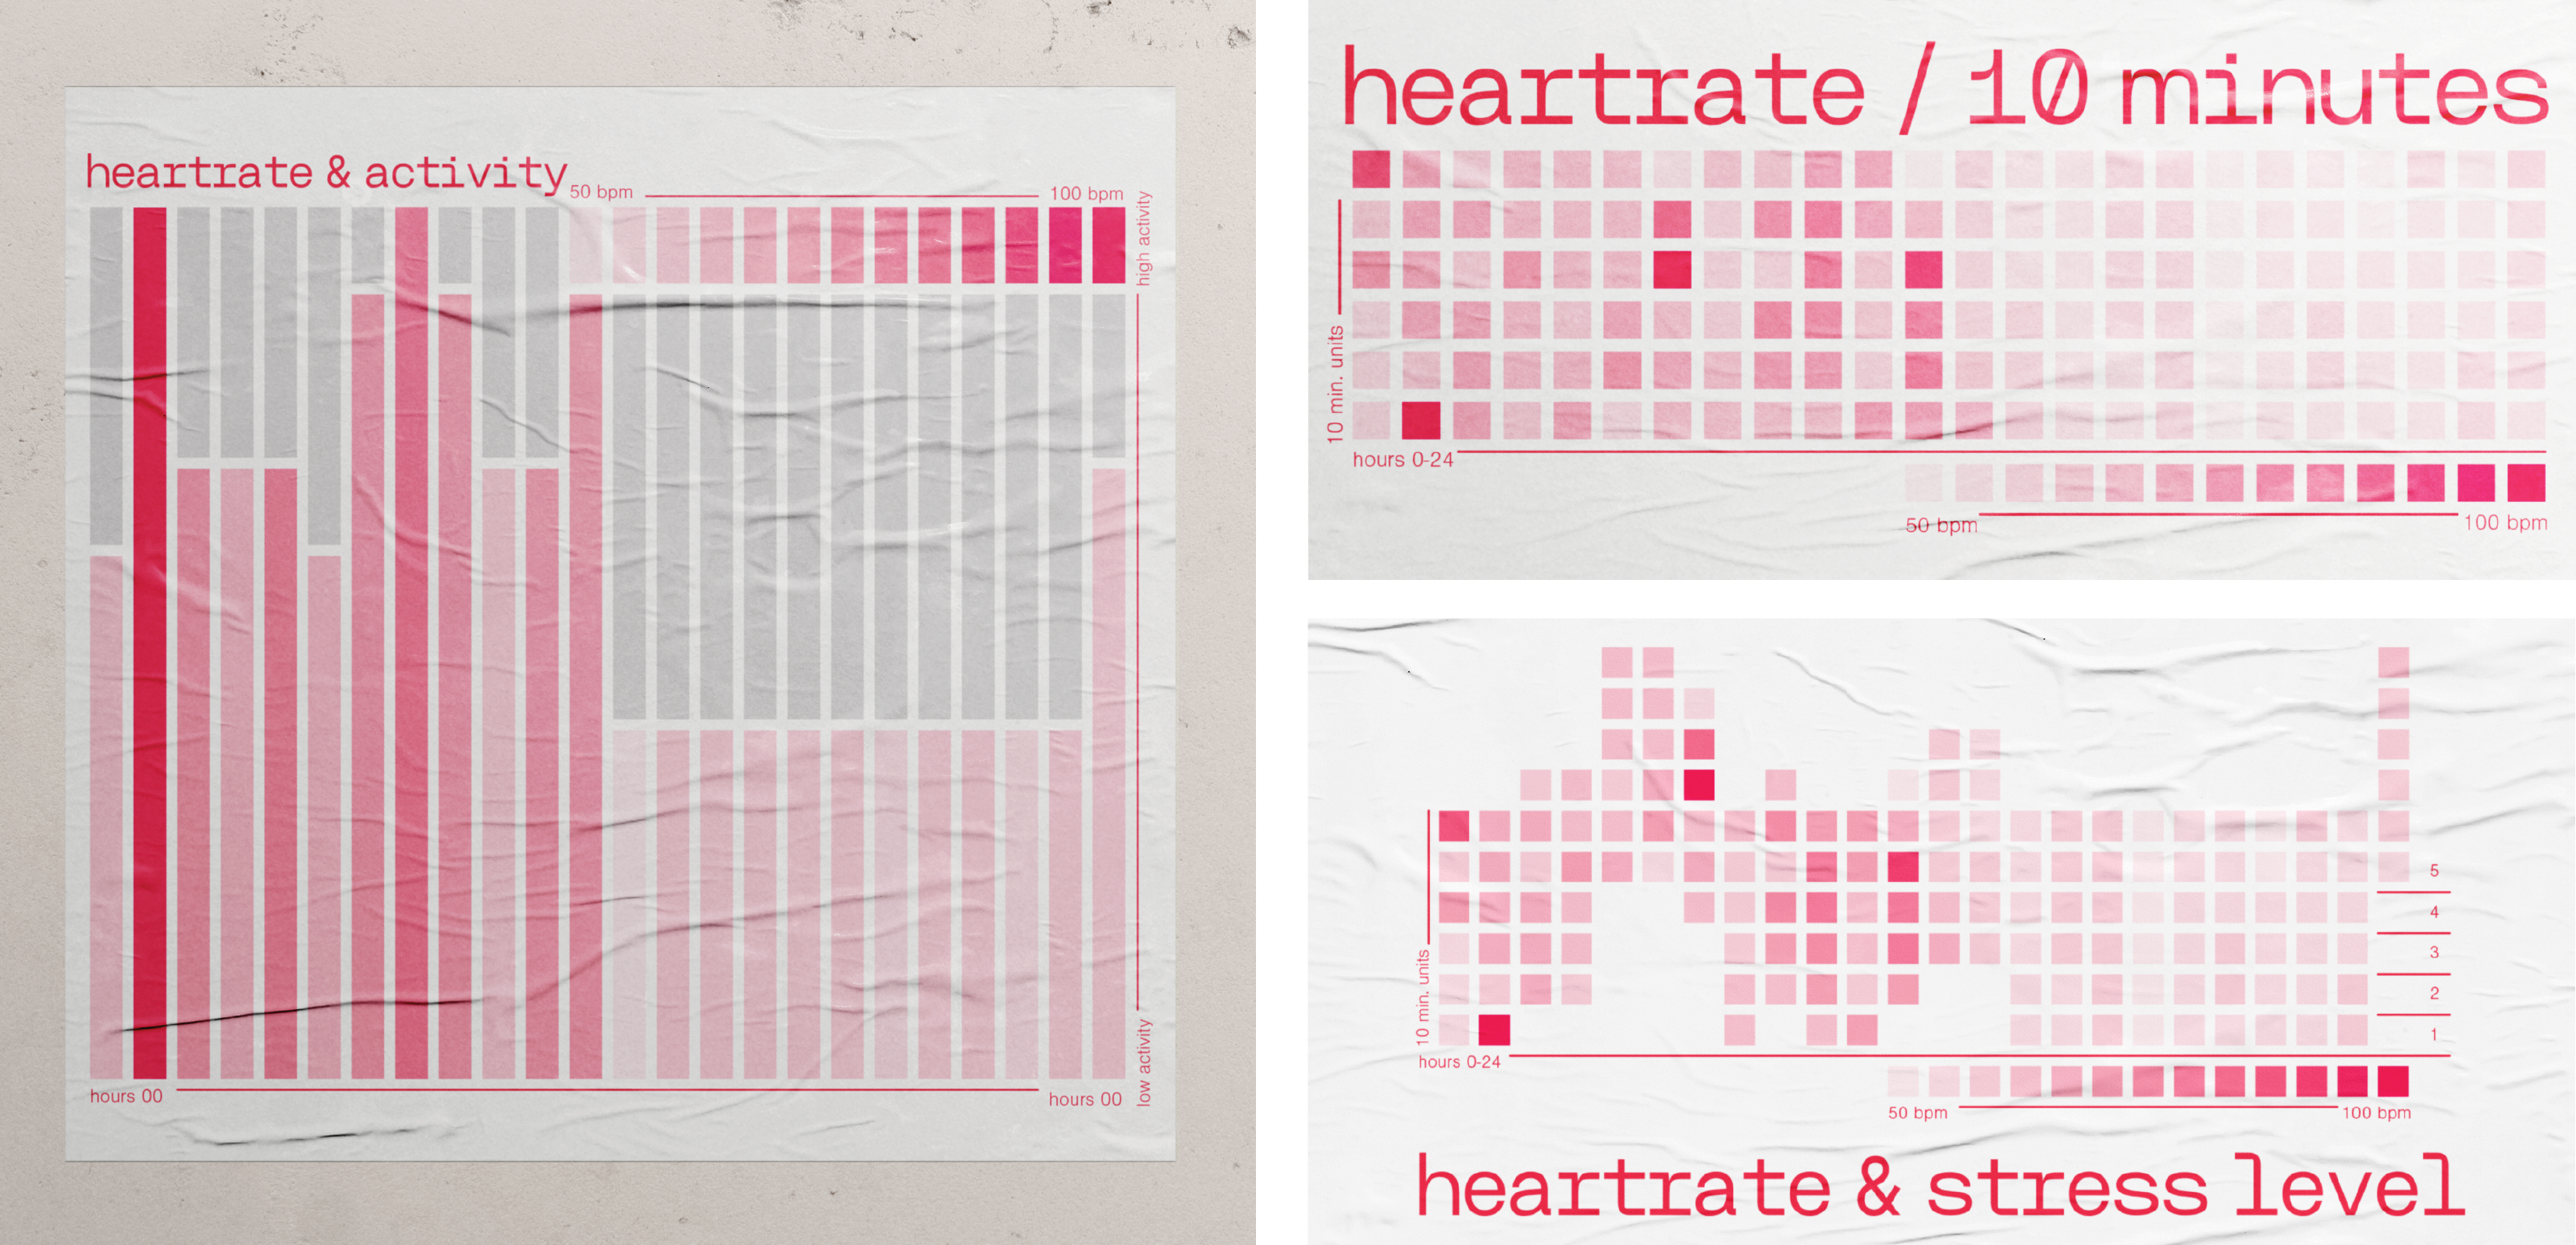
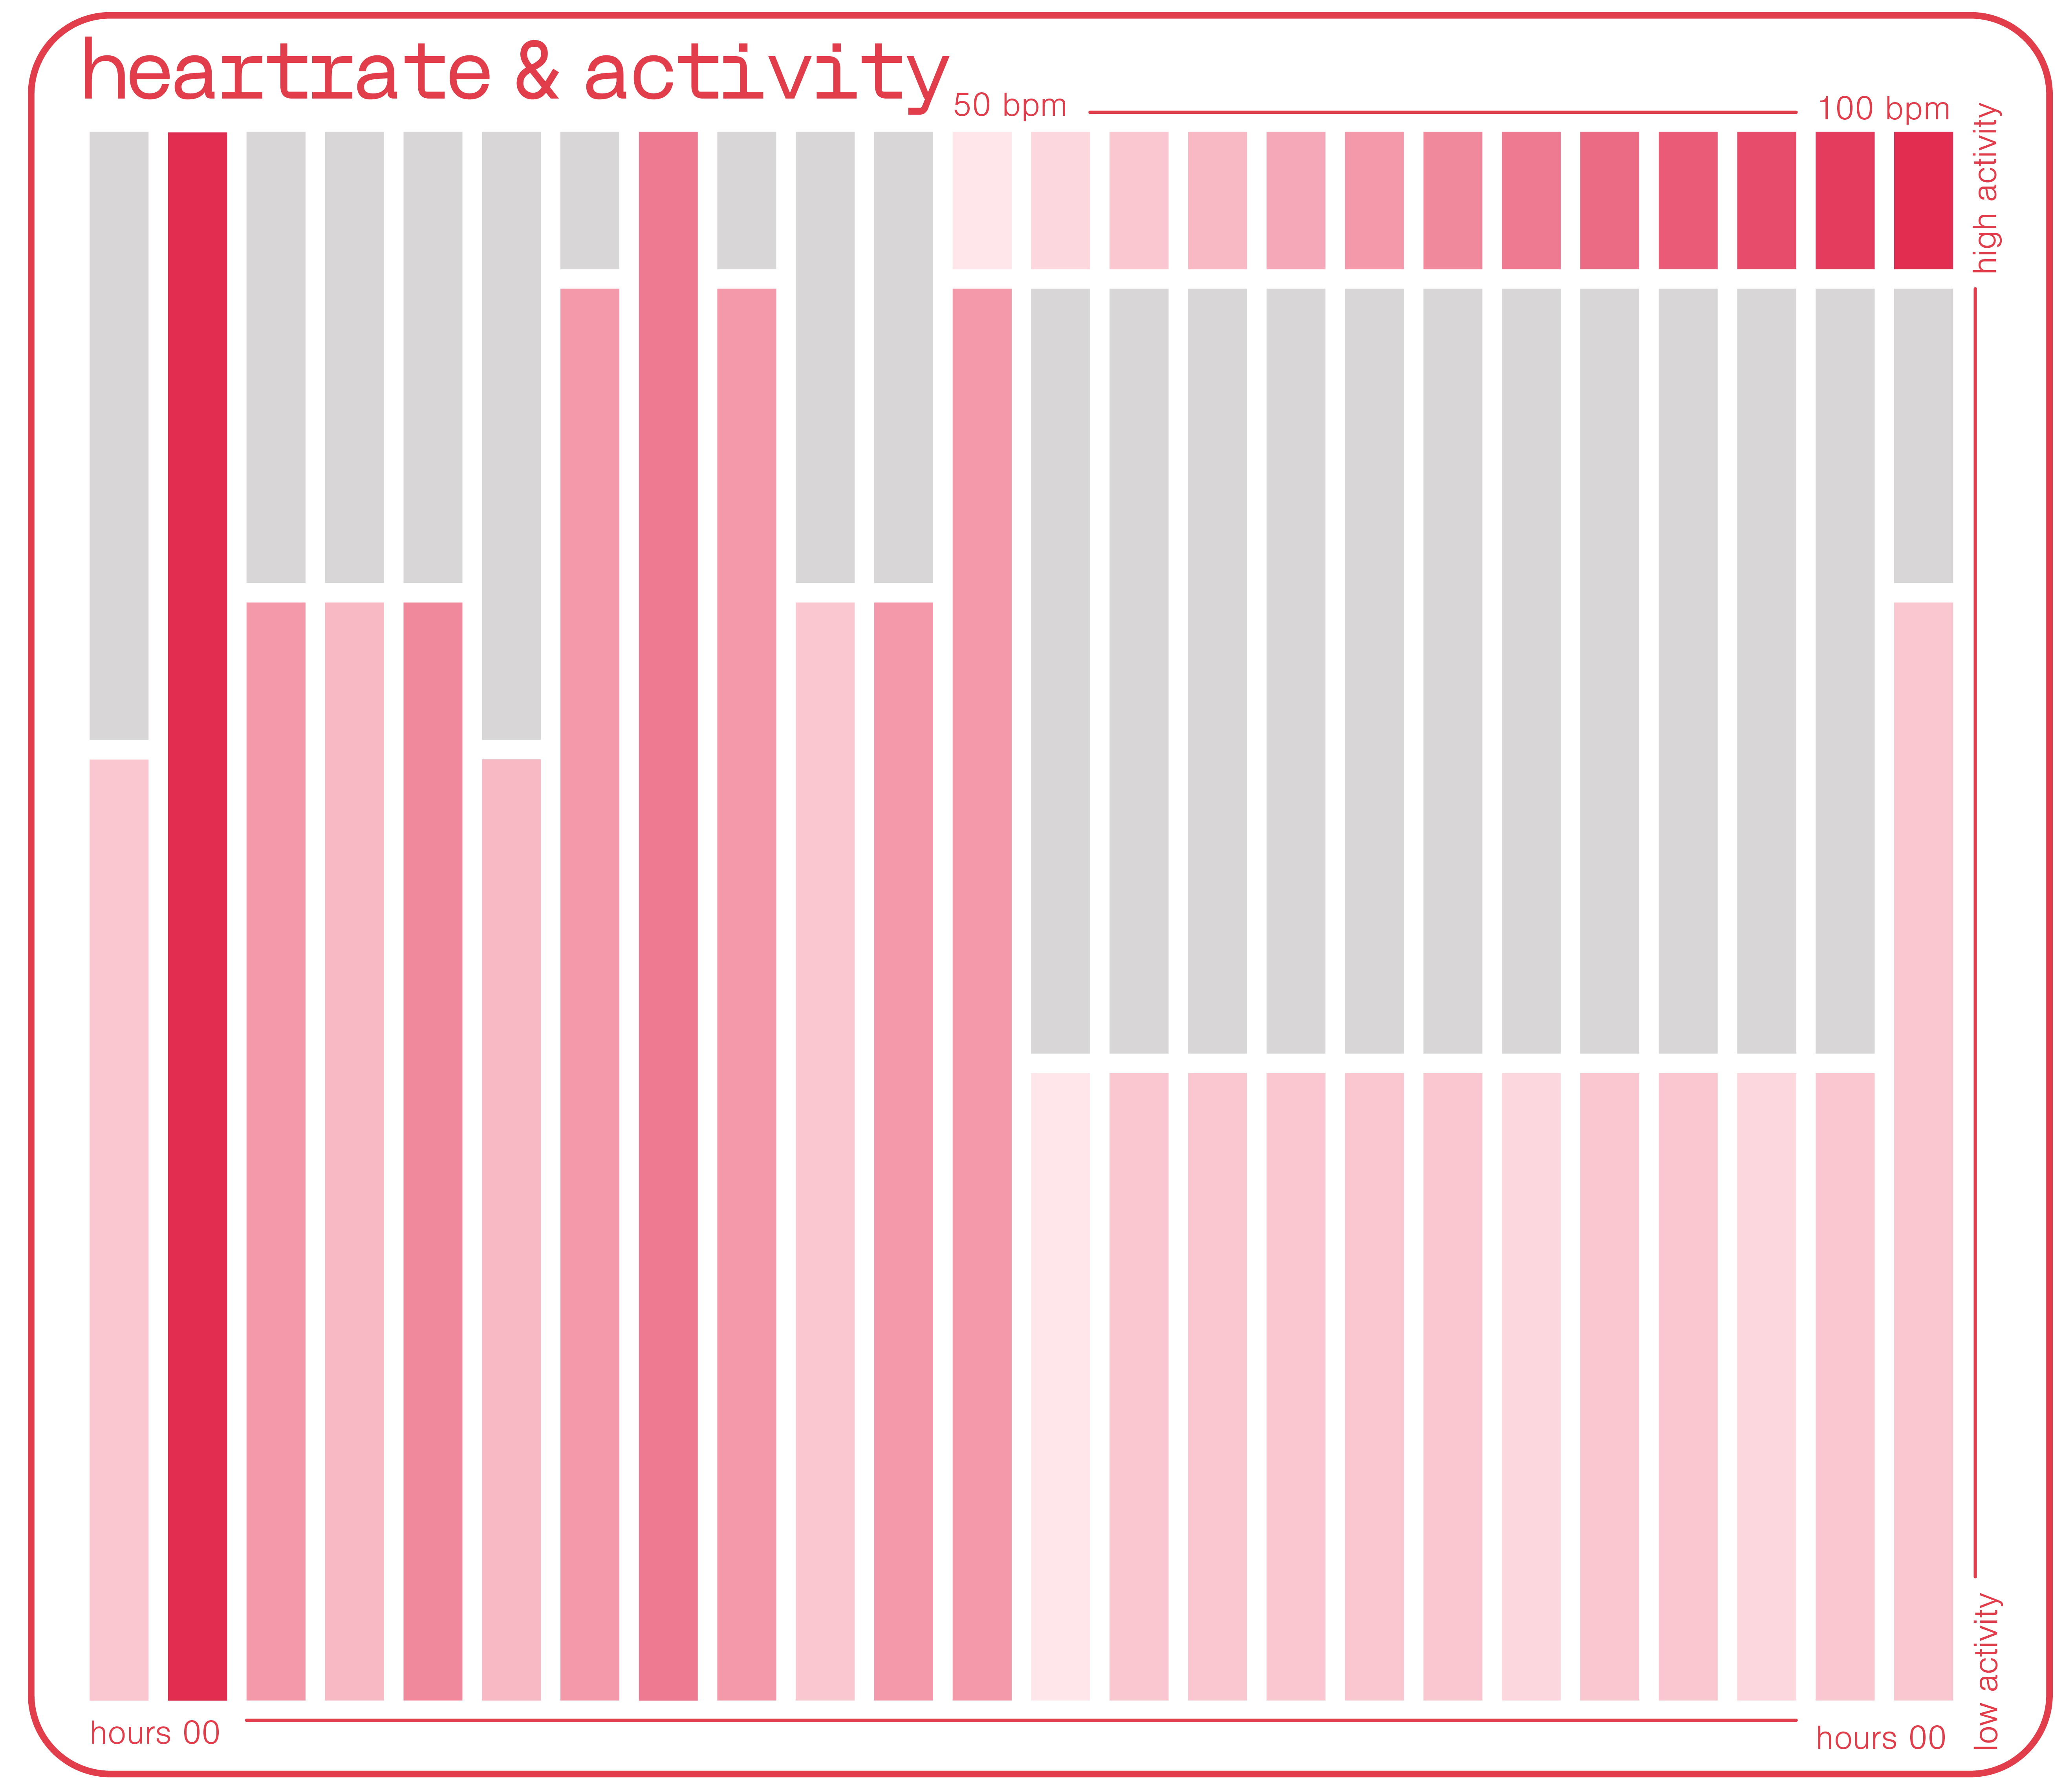
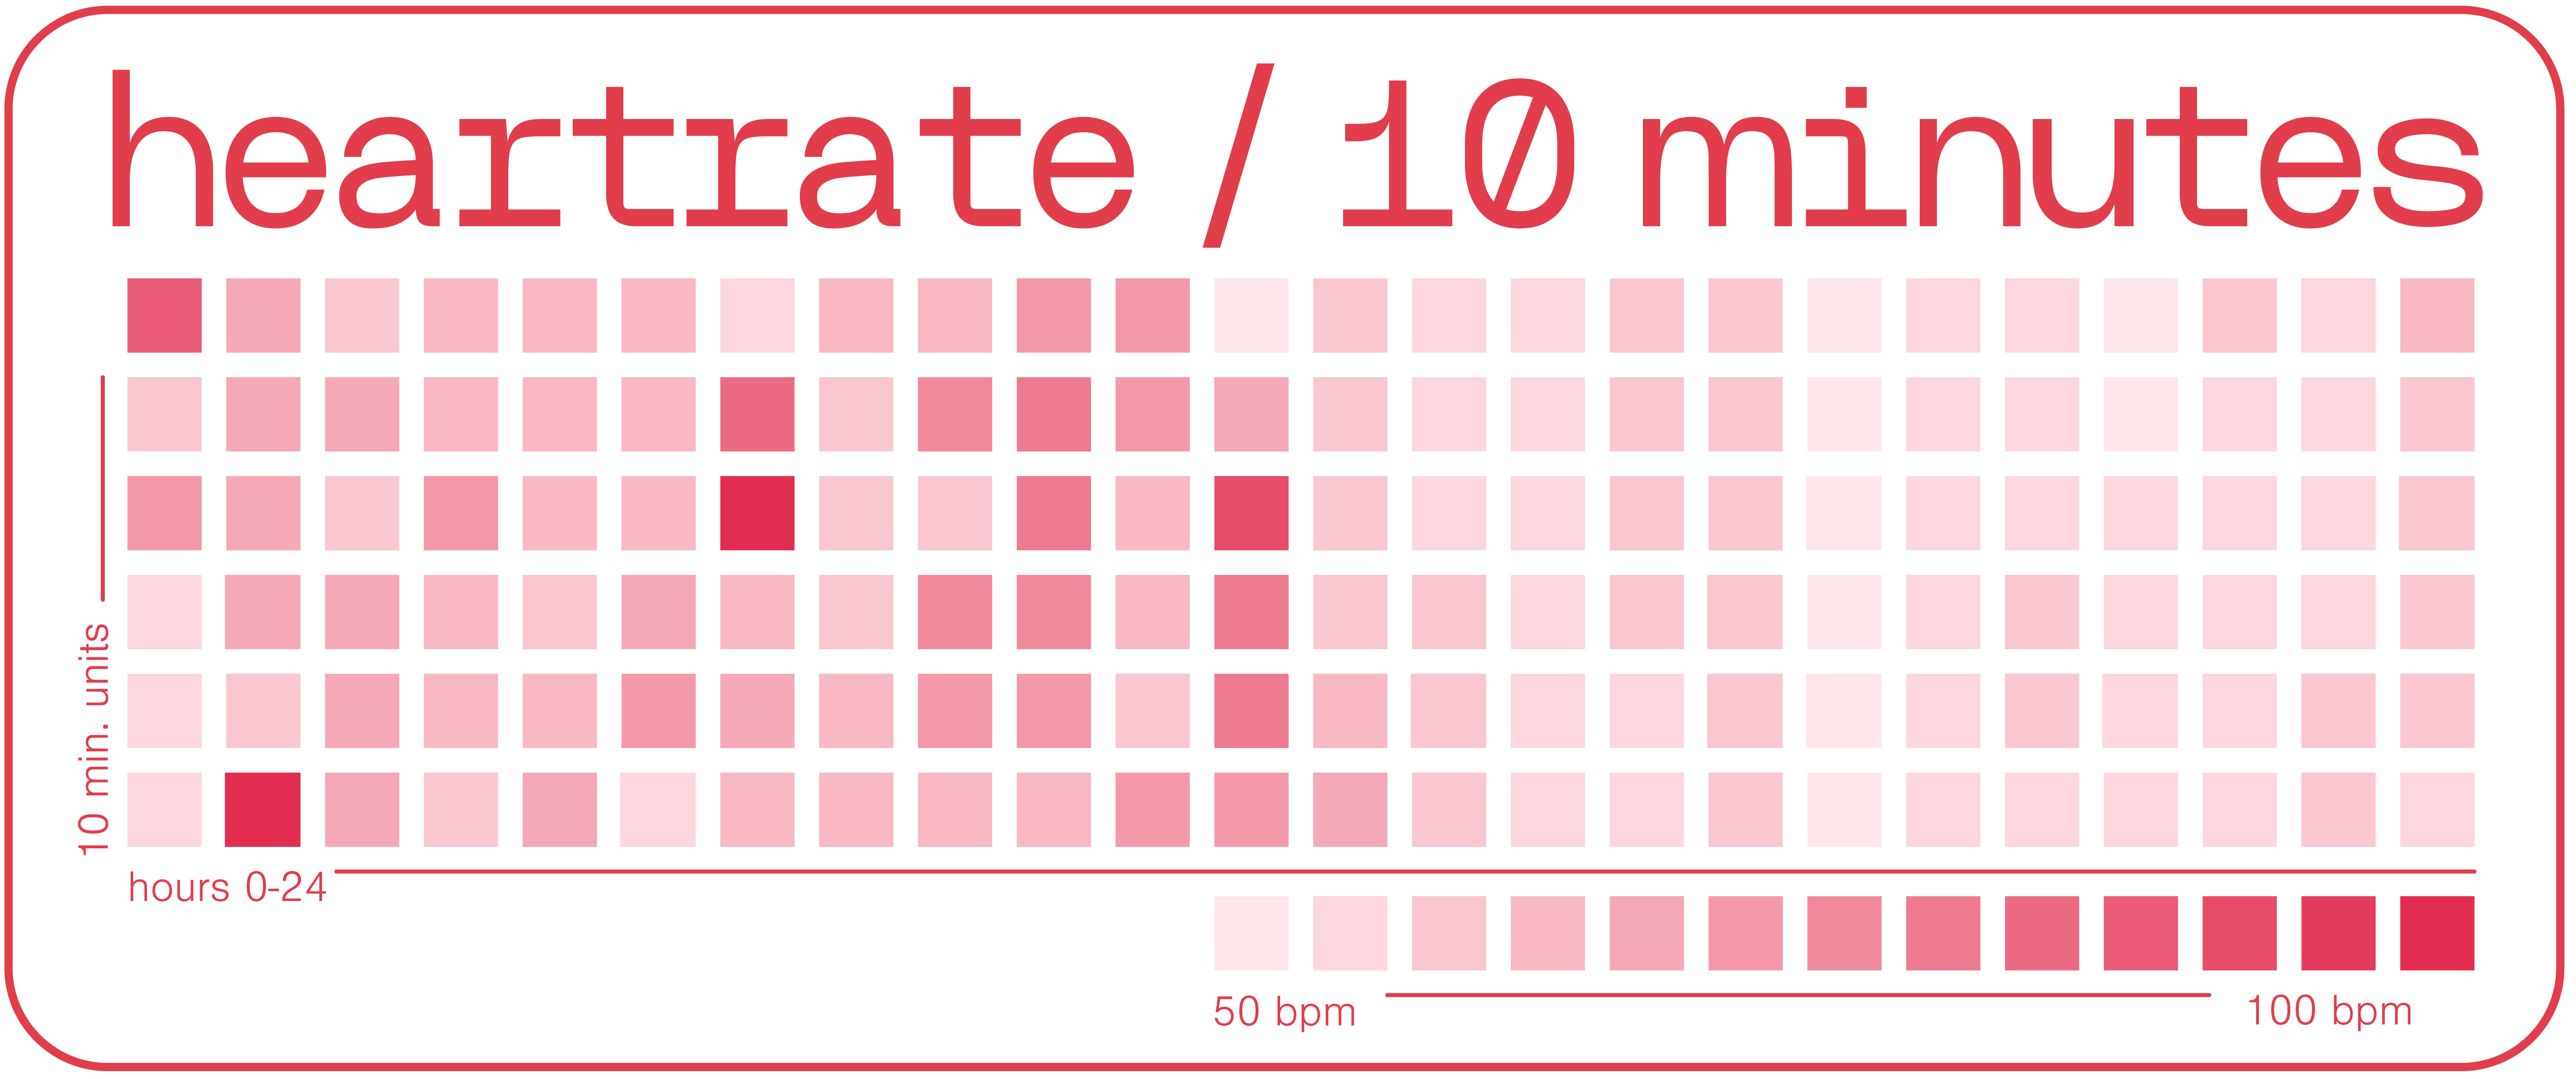
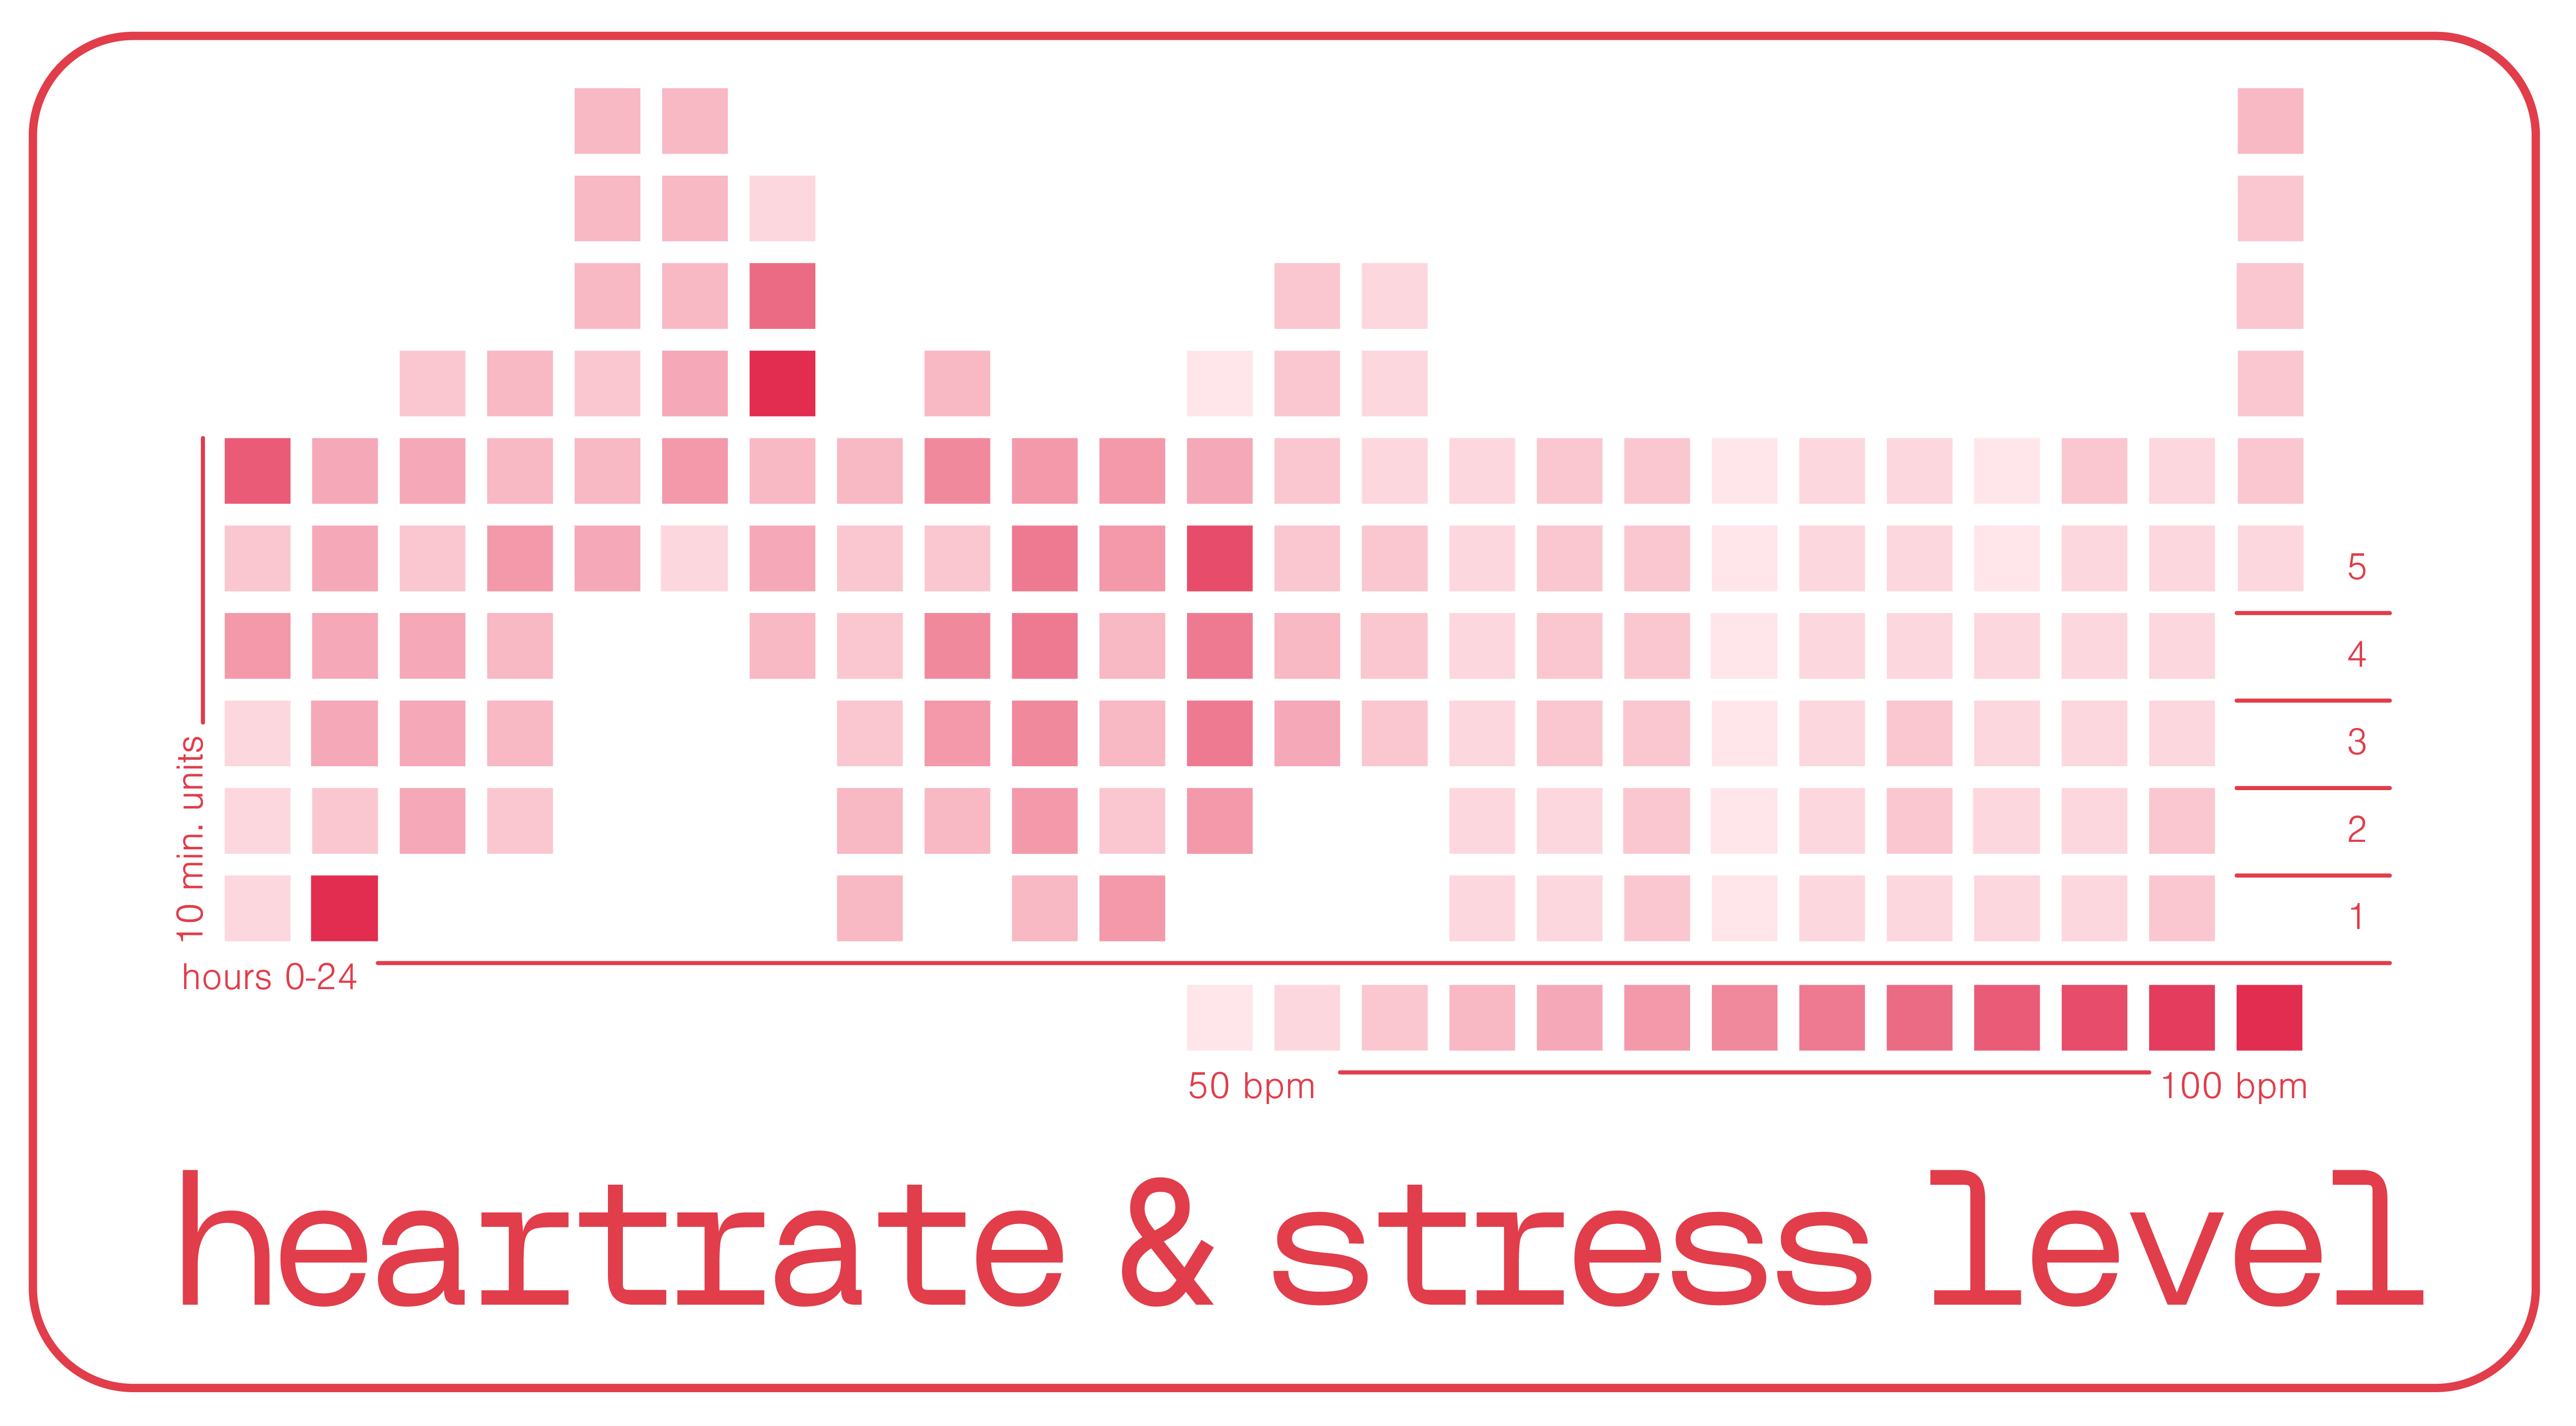
// Final visual explorations of heartrate and other qualitative datapoints. ︎︎︎
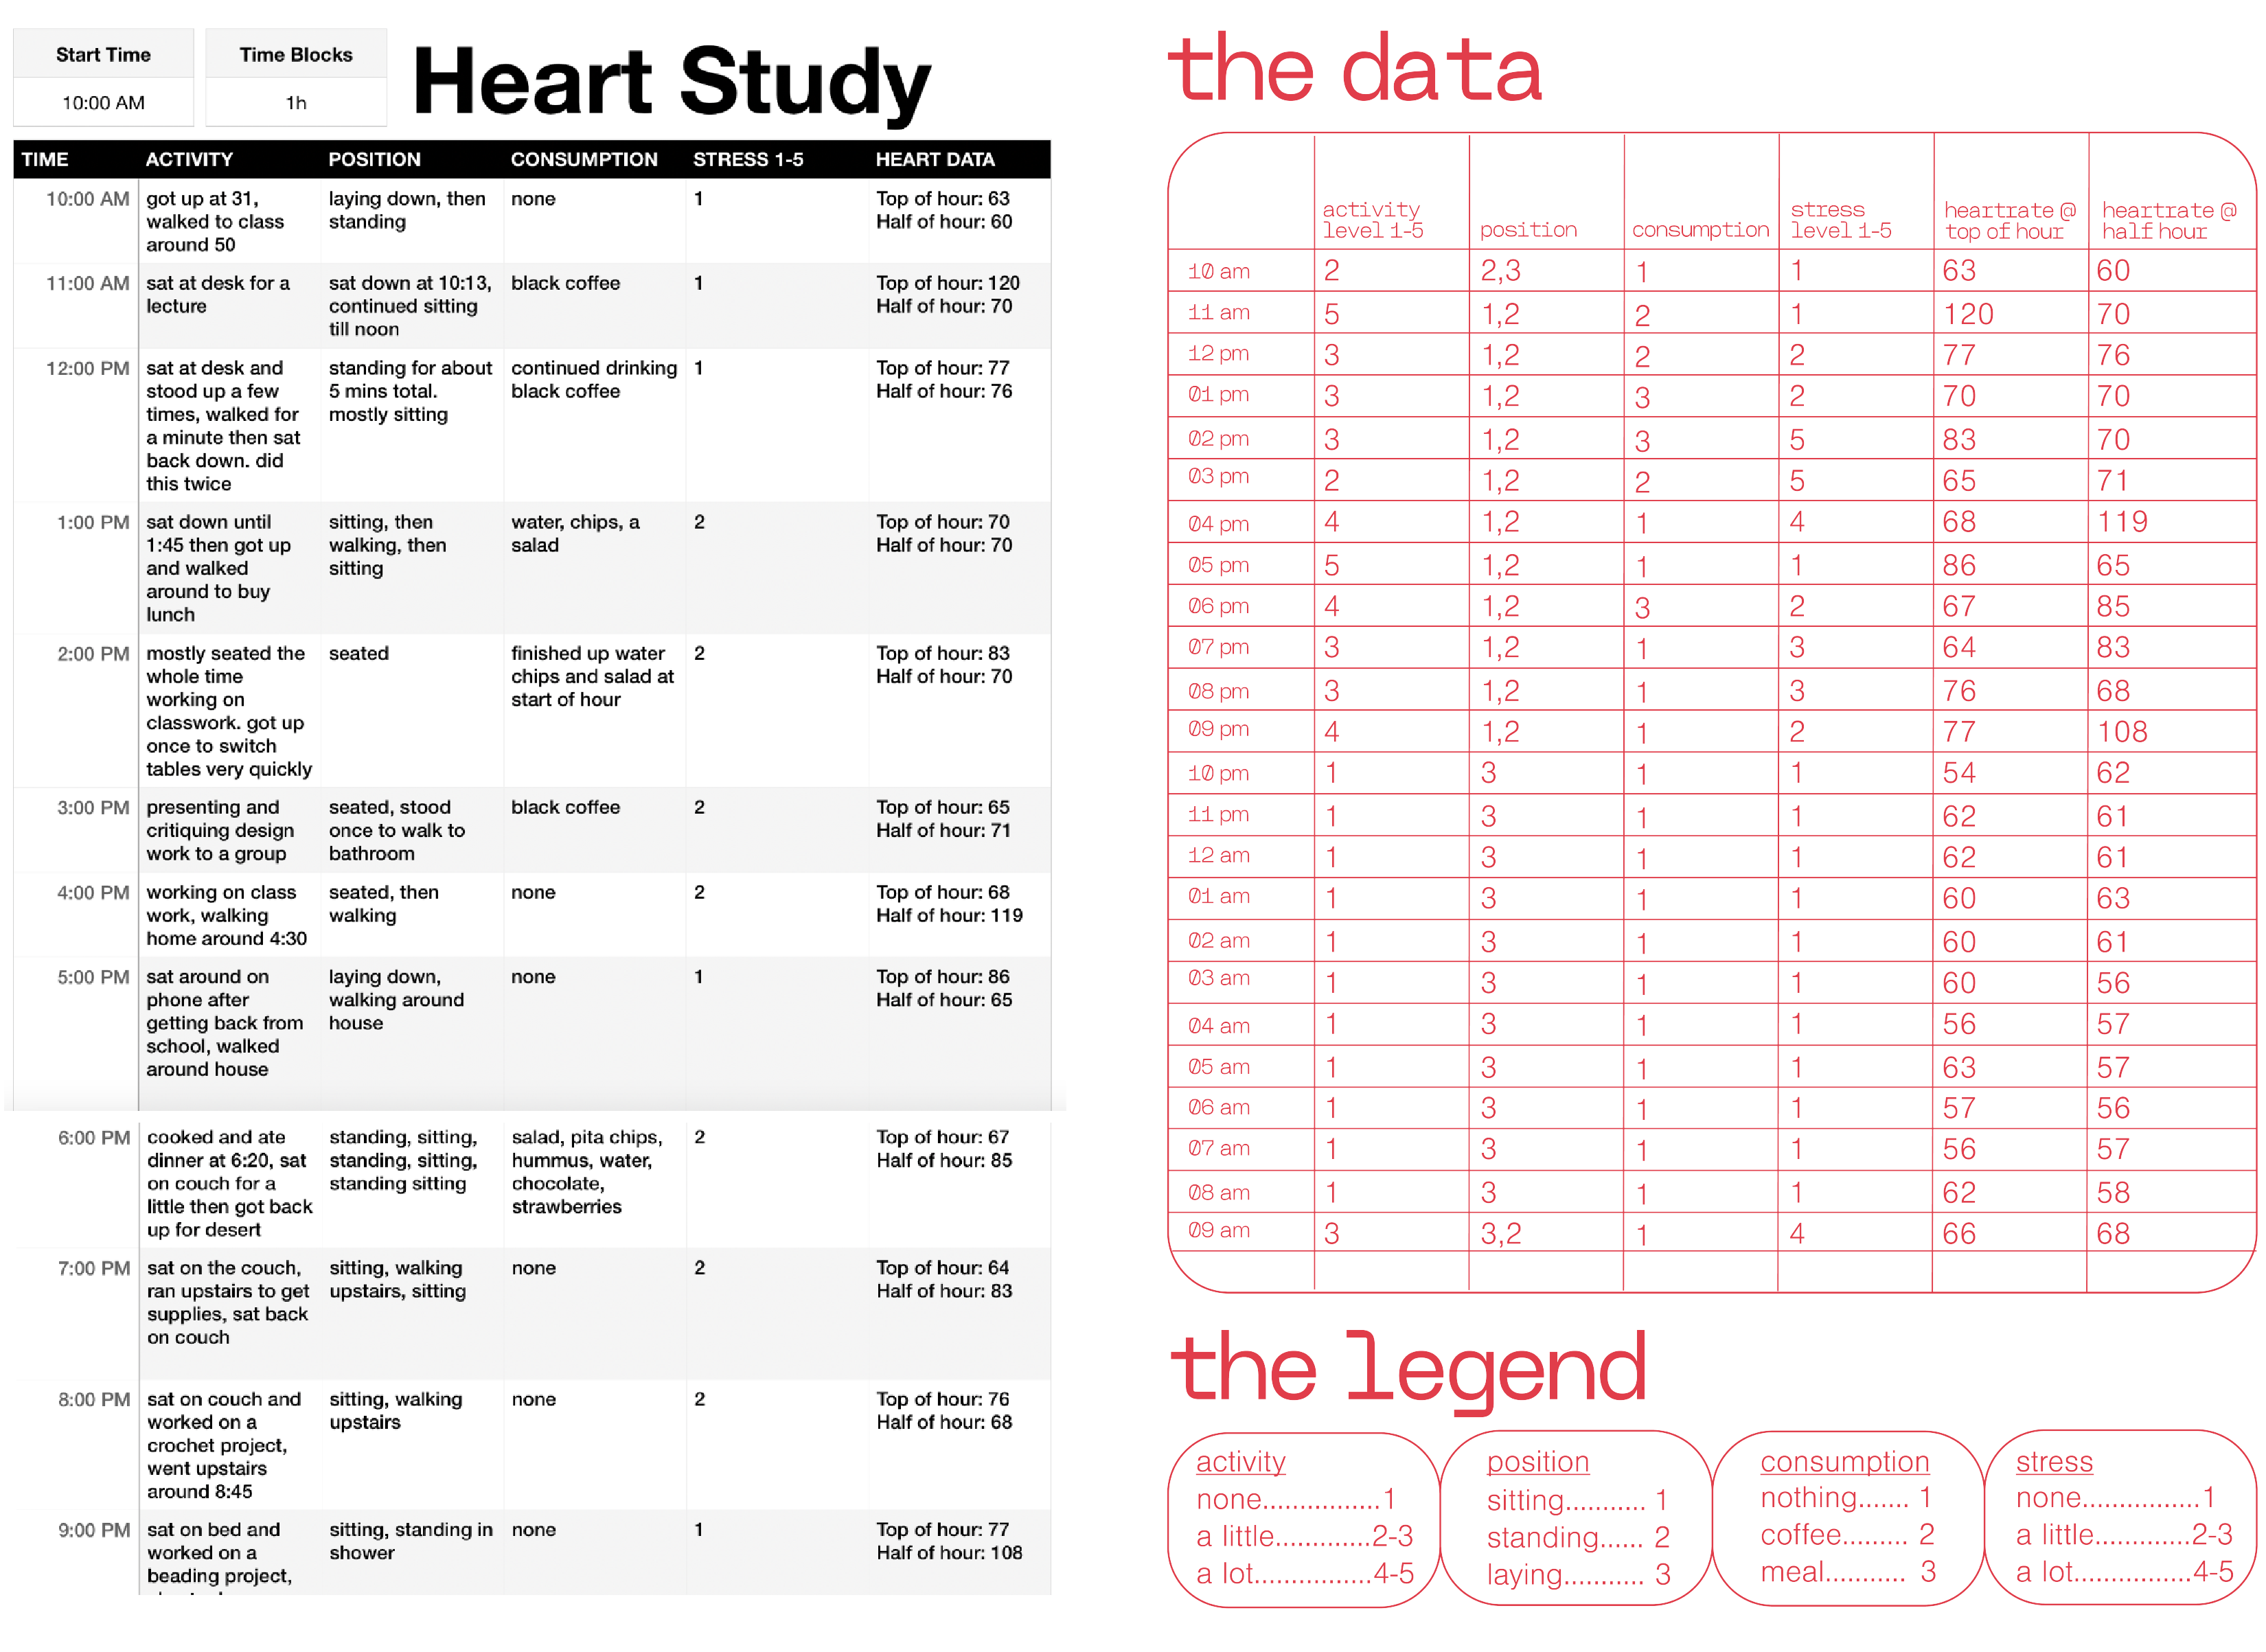
// Original datatable from the date of study next to the codified and designed datatable ︎︎︎
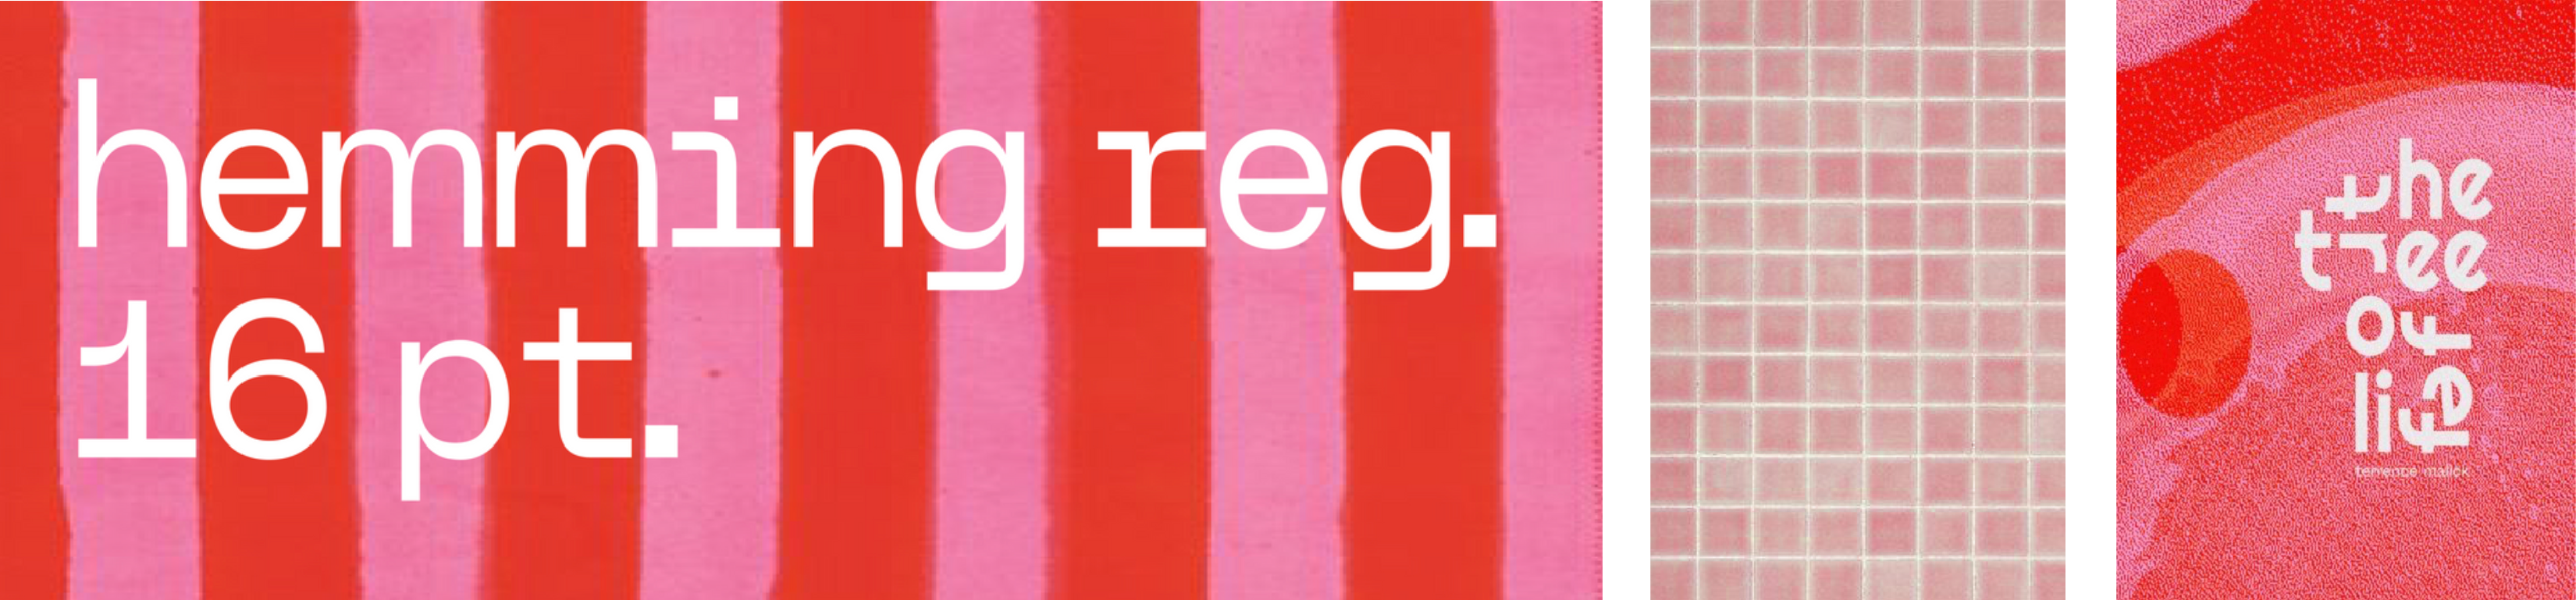
// Color and typography inspiration images reflecting the visual style to be employed ︎︎︎
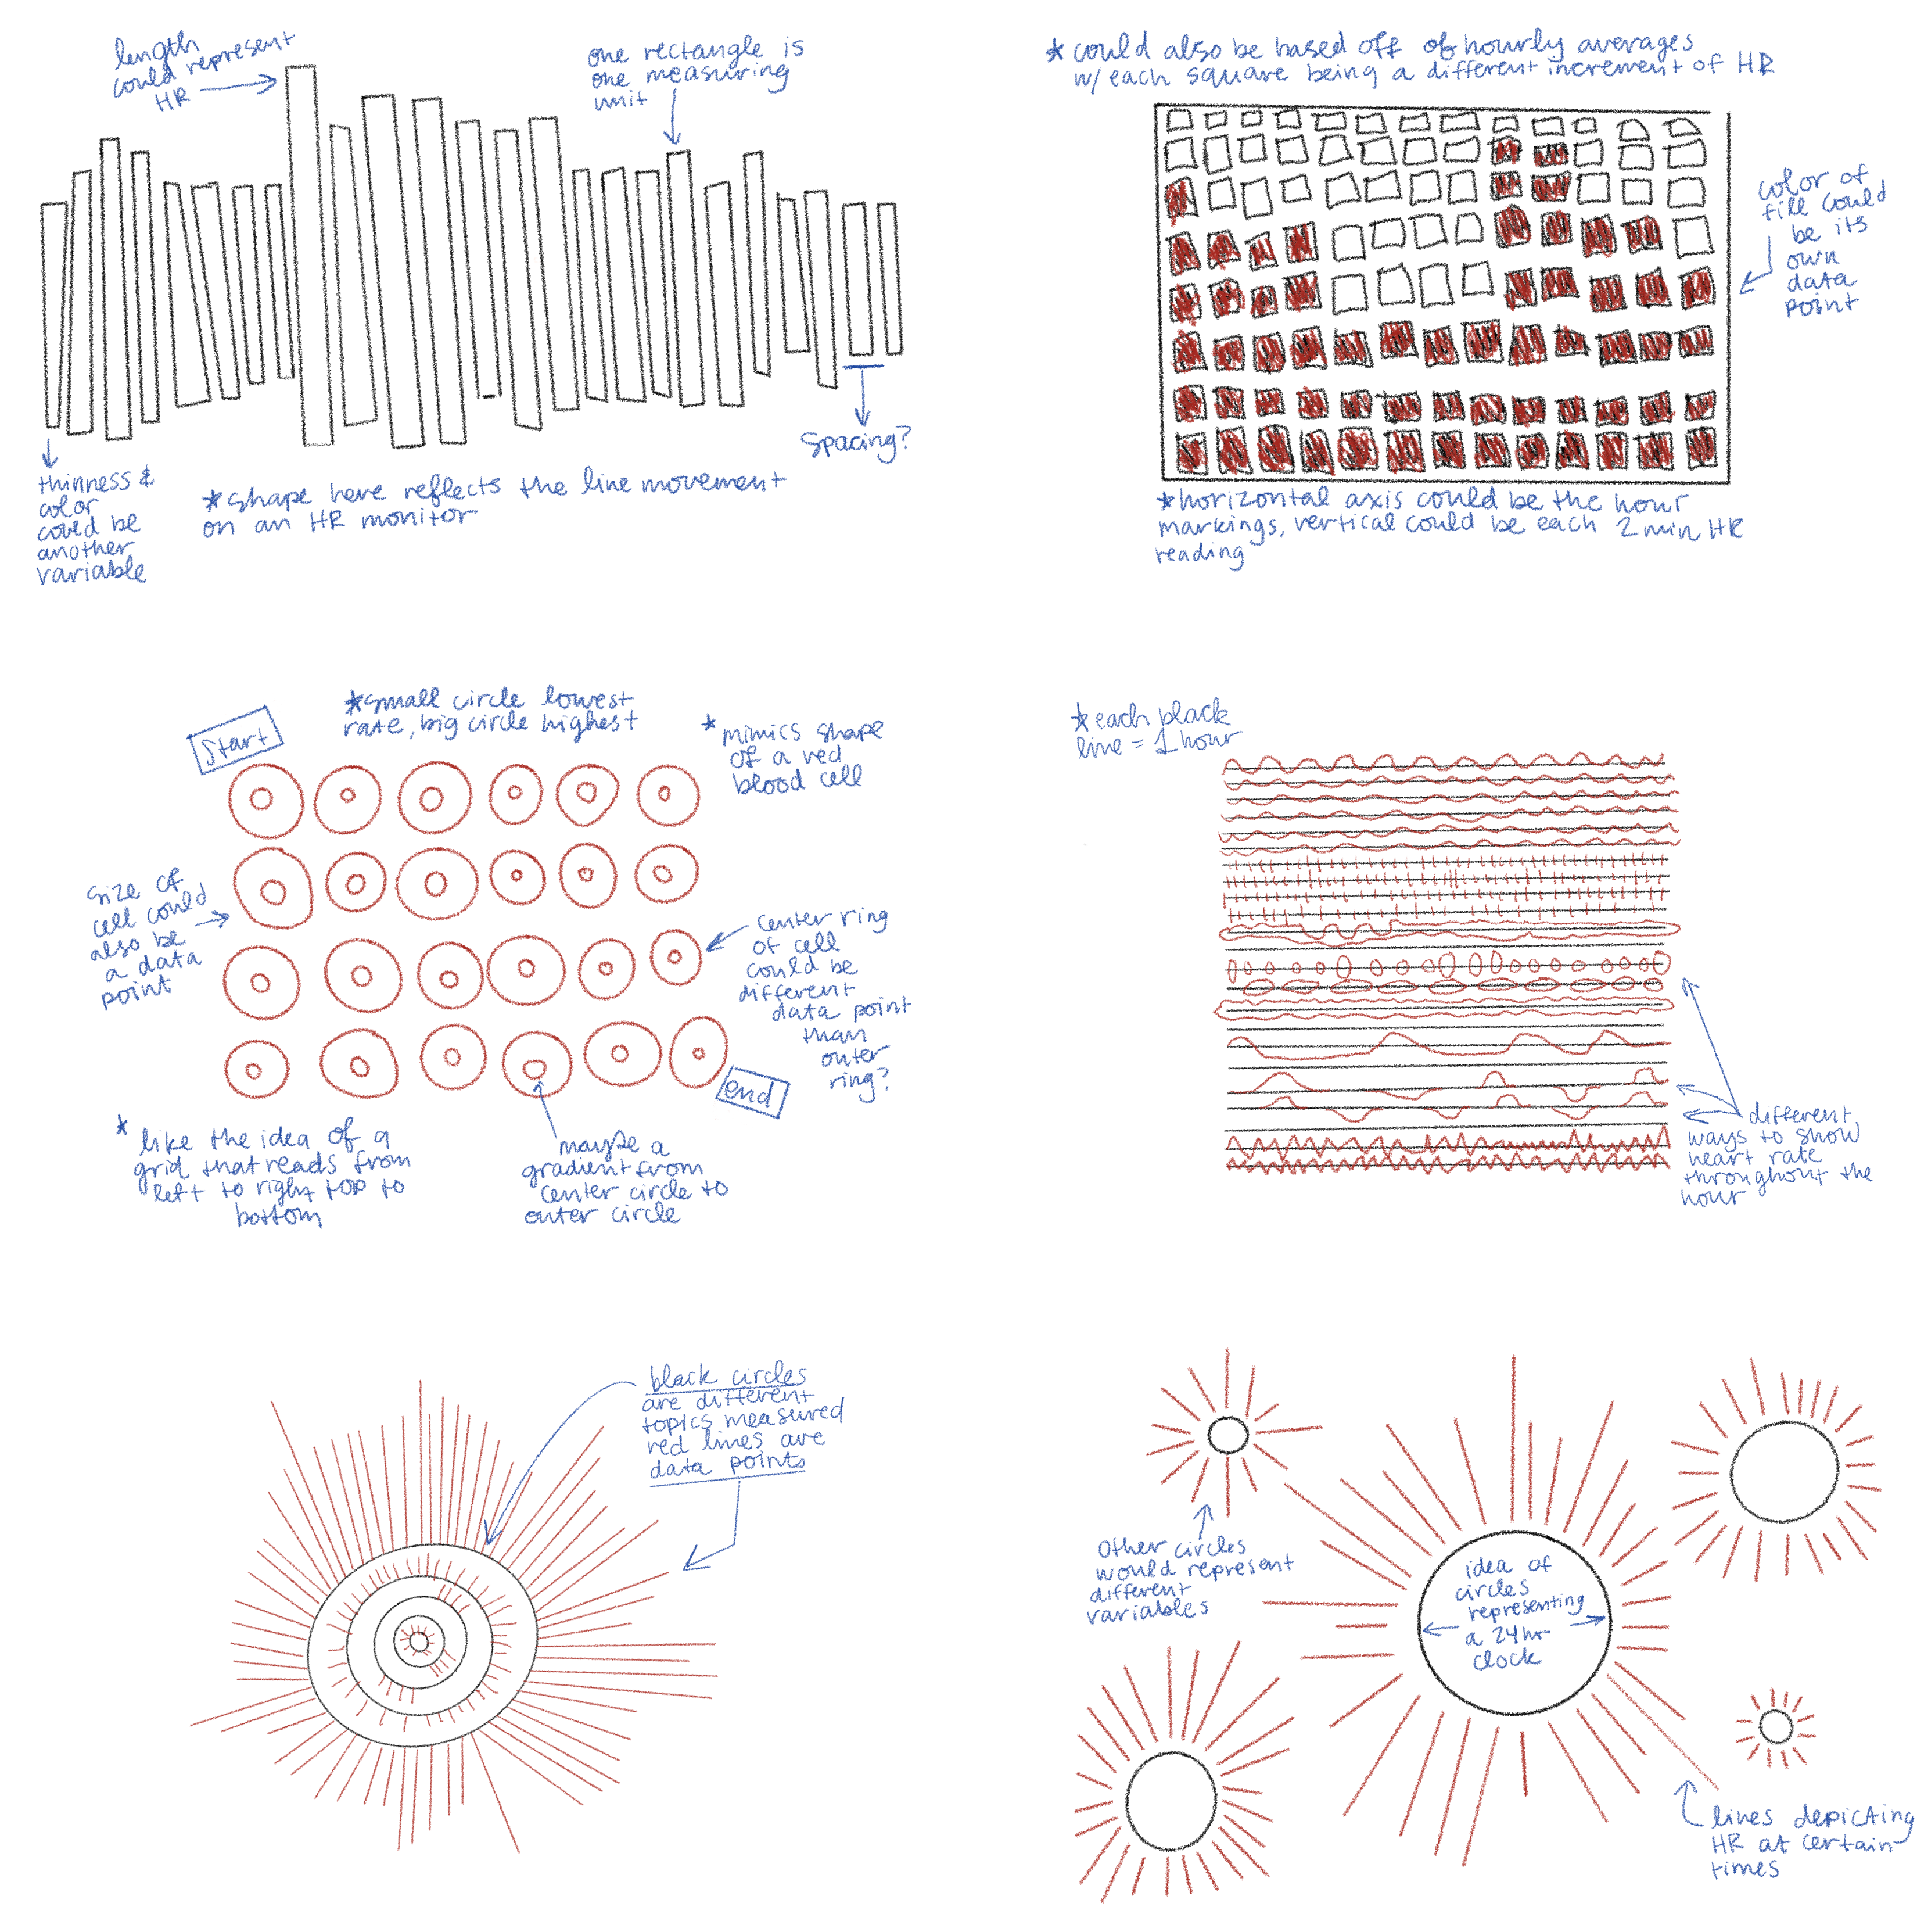
// Hand-drawn concept sketches for possible routes of conveying information ︎︎︎
// Final concepts portraying multiple variables dependent on heartrate throughout the 24 hour study︎︎︎